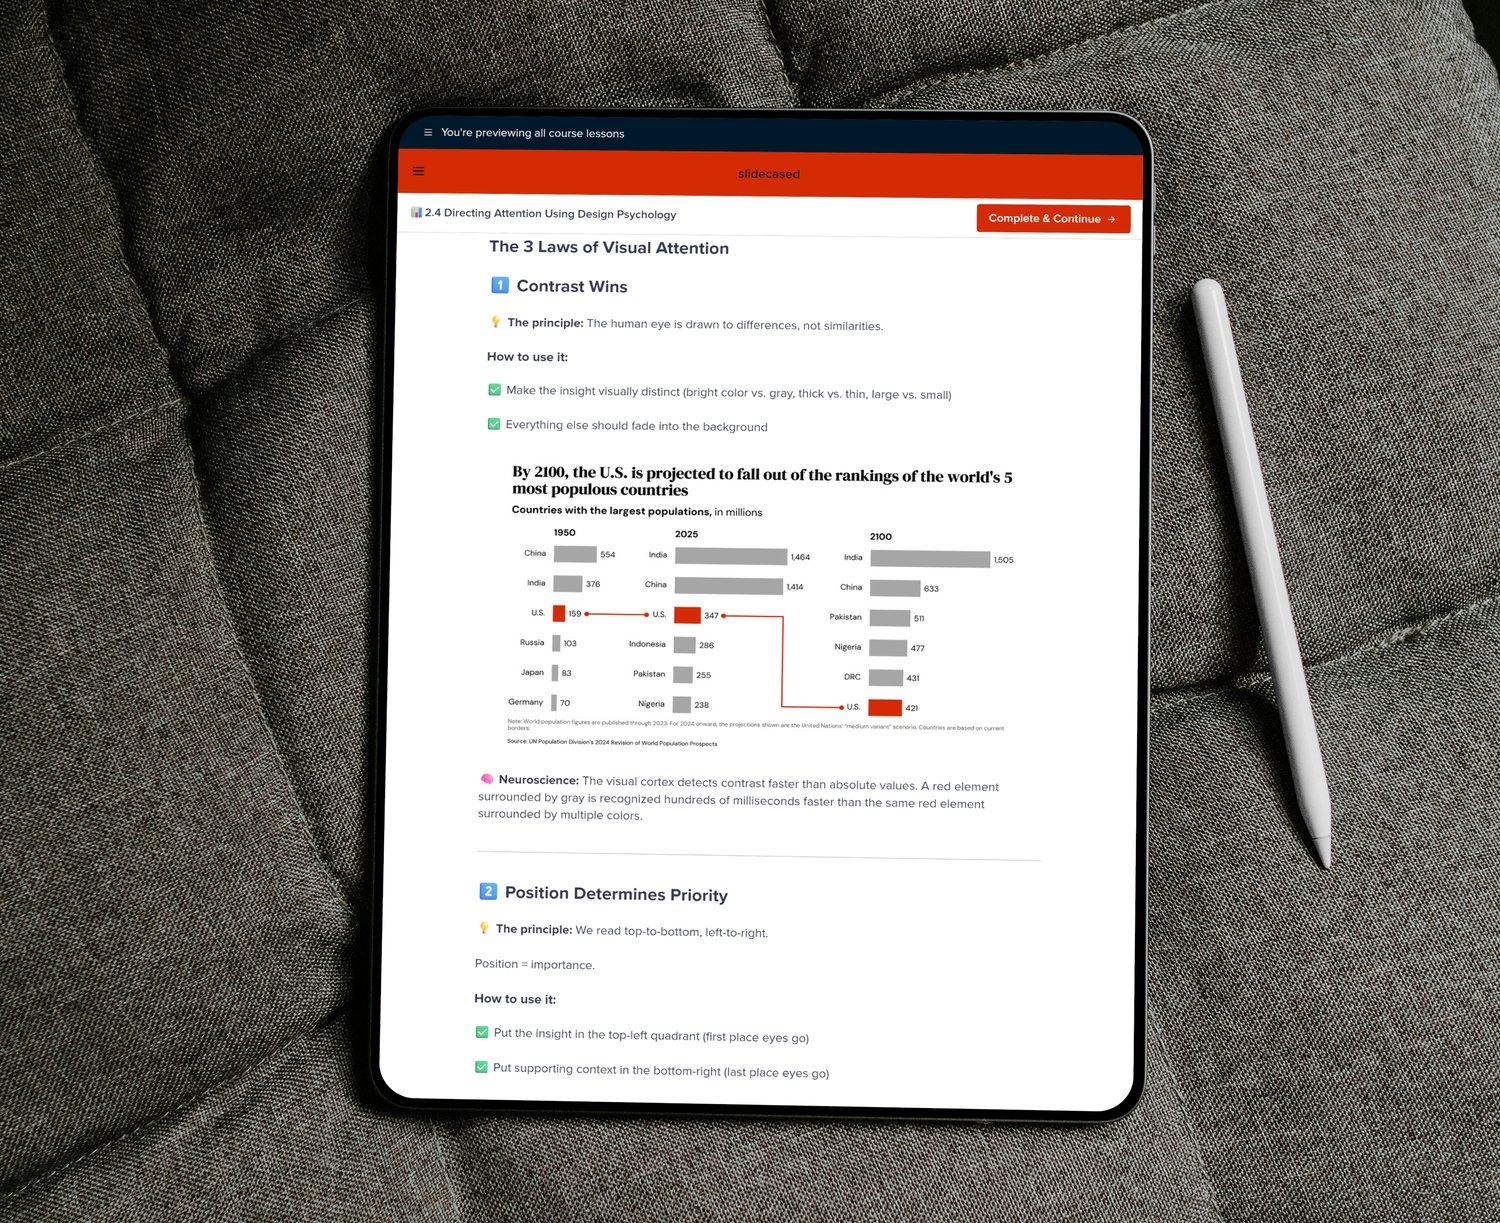
Turn Raw Data Into Stories That Stick
The complete system for creating decision-driving charts, not just information displays

The complete system for creating decision-driving charts, not just information displays

Most of us follow the same ritual when handed a dataset:
We open Excel or PowerPoint. Paste the data. Pick a chart that looks decent. Then spend the next hour tweaking colors, adjusting fonts, and moving legends around—hoping clarity will somehow emerge.
Hours later, we call it done and present it.
But then—people ask follow-up questions you thought the visual already answered. The insight doesn't land.
Not because it's wrong—but because it was never made obvious.
The issue isn't the data. It's the thinking that came before the chart.
The best analysts, consultants, and research teams don't guess their way into clarity.
They don't rely on aesthetics or trial-and-error design.
They start with the insight.
They know what matters before they open a tool.
They choose visual structures that guide attention, not distract from it.
And when they present, the room doesn't ask, "What does this mean?"
They ask, "What's the next step?"
That's not talent.
It's not fancy software.
It's a system.
A repeatable way to:
➡️ Extract the real insight first
➡️ Choose the right visual structure
➡️ Design with intention
➡️ And deliver charts that actually stick
Top firms like McKinsey, BCG, and Bain follow this system every day—refined across thousands of decks, reports, and executive rooms.
But it's rarely written down.
Until now.
A practical, tool-agnostic system for turning raw data into clear stories that stick.
Anyone who works with data and needs people to get it, including:

Turn accurate analysis into clear insights stakeholders grasp immediately.

Present complex findings as compelling, client-ready stories that drive decisions.

Cut through noise faster and make confident decisions from data you trust.
Learn to extract insights, design with purpose, and deliver presentations that move people to action.
Extract the insight that matters before opening any tool. Frame data with context and think like a strategist—not just an analyst.
Choose the right chart type, remove visual clutter, and use design psychology to guide attention. Make your insights impossible to miss.
Structure narratives from context to action, design slides that land instantly, and present with confidence to drive decisions.
Beyond the three core modules, this playbook includes practical tools you can use immediately:
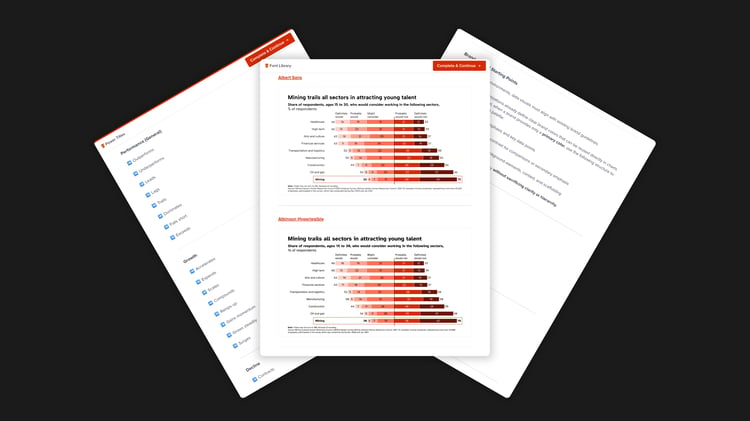
Fonts, colors, and title language standards for consistently clear communication.
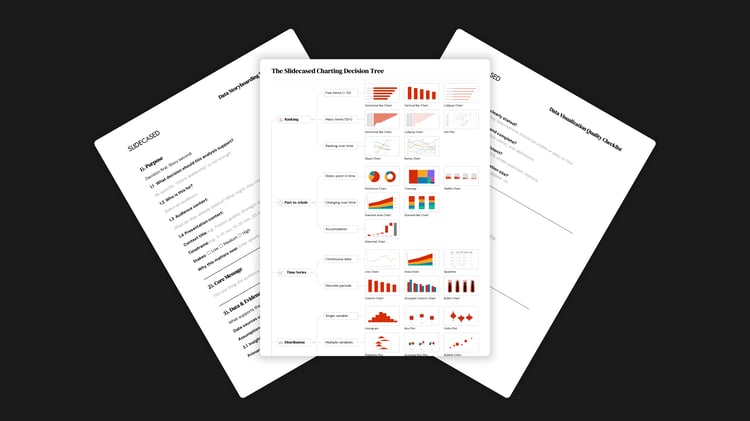
Frameworks and checklists to plan, validate, and structure data stories.
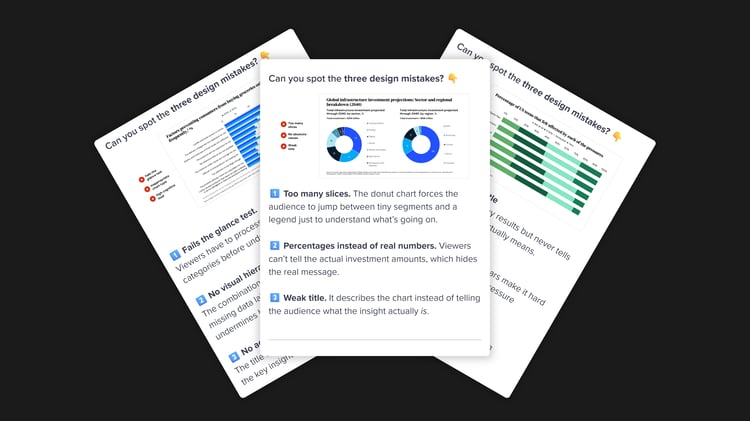
Ready-made charts and real transformations demonstrating principles applied correctly.
No. This isn’t a traditional course—it’s a playbook.
While it’s hosted on a course platform for easy access, it’s designed as a reference system, not a linear set of lessons. You don’t “progress” through modules in order. Instead, you jump straight to what you need in the moment—insight frameworks, slide structures, charting rules, and ready-to-use resources.
It’s built to stay open on your desk while you work, so each time you use it, your process becomes faster, clearer, and more effective.
Immediately.
If you have a presentation this week, you can apply the playbook today. Your slides become easier to follow, your message sharper, and your delivery more confident—without weeks of study.
No.
Every principle works with whatever you already use—Excel, PowerPoint, Google Sheets, Tableau, Power BI, Python, R, or other tools. The examples use Excel and PowerPoint because they're widely accessible, but you can apply everything you learn to whatever tools you prefer.
Both.
➡️ Beginners get a clear, proven system to follow from day one
➡️ Experienced users get structure, consistency, and gaps filled they didn’t realize existed
The principles scale from simple charts to complex dashboards.
You can read all three modules in about 3–4 hours.
But it’s not meant to be read once and shelved. Most users reference individual sections while working on real projects. The templates, checklists, and worksheets are built for daily use.
That’s when this matters most.
High-stakes presentations often influence promotions, funding, and approvals. The playbook ensures those moments stand out and drive action—rather than getting overlooked.
It works for all formats.
The core principles apply to dashboards, written reports, executive summaries, and async updates—not just live presentations. Module 3 focuses on delivery, but Modules 1 and 2 are universal.
Anyone who needs to communicate data clearly.
Analysts, consultants, managers, marketers, researchers, product teams, and executives—across finance, healthcare, tech, retail, government, education, and more.
If you present data, this applies.
Most resources focus on tools or aesthetics.
This playbook teaches a complete system:
➡️ Extracting insights
➡️ Choosing the right visual structure
➡️ Designing for clarity
➡️ Delivering with confidence
It’s principle-driven, tool-agnostic, and immediately usable—plus it includes templates, worksheets, and real examples you’ll reference daily.
The standard license is for individual use, but team licenses are available with volume discounts. Contact us for team pricing.
As the Data Viz Pro Playbook is a digital product, we do not offer refunds. We encourage you to review the product details and features carefully before making your purchase.
Yes. If you need help or have questions, reach out here. We're here to help you get the most value from the playbook.
Don’t hesitate to reach out—we’re here to help!